
Monitoring systems for unusual bridge conditions.

These projects show how Infratico measures bridge response during severe cold, remote operation, and unusual loading events.

Remote bridge instrumentation below -50°F.

Alaska · Cold-region bridge monitoring

Infratico worked with the Alaska Department of Transportation to install monitoring systems on critical bridges in remote, high-load areas. Continuous field data shows structural behavior that is difficult to observe during an inspection.

The temperature at the project sites often drops below -50°F. It can approach -60°F during high winds on exposed bridges. Infratico designed the monitoring hardware to operate below the typical -40°F electronics limit. The installed systems continue to collect and process bridge-response data during winter.
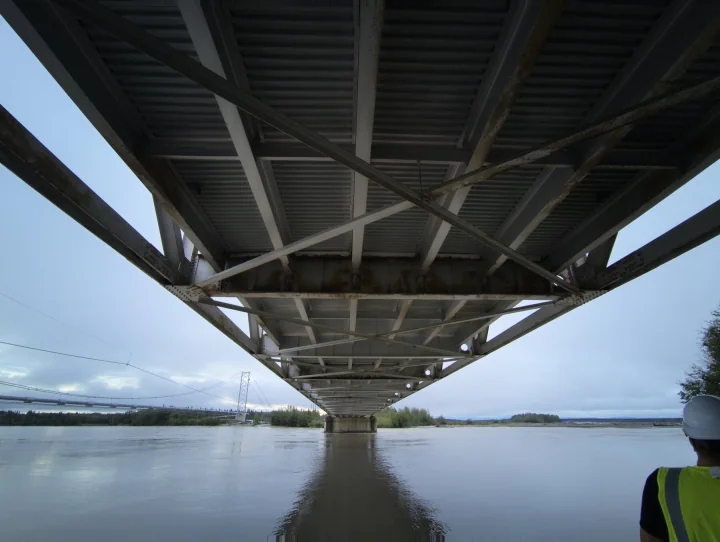
Underside of an Alaska bridge over a river
The underside of one of the Alaska bridges that Infratico instrumented.

The project also uses automated drone inspection, custom finite-element analysis, and patented anomaly detection methods. These tools connect field measurements to a structural model. Engineers can review a measured change with the bridge geometry, loading, and local conditions.

Mackinac Bridge over the water at sunset

Mackinac Bridge monitoring and Labor Day walk response.

Michigan · Mackinac Bridge monitoring

Each year on Labor Day, Michigan residents walk across the Mackinac Bridge. The event draws thousands of people. Large groups walk at a similar cadence and apply a repeated load to the bridge.

Infratico works with the Mackinac Bridge Authority on custom wireless sensors, load analysis, vibration analysis, cloud monitoring, and anomaly detection. Sensor installation started in 2016. The systems continue to send monitoring data.

The sensors harvest power from bridge vibration, which supports long-term monitoring without routine battery changes in difficult maintenance locations.

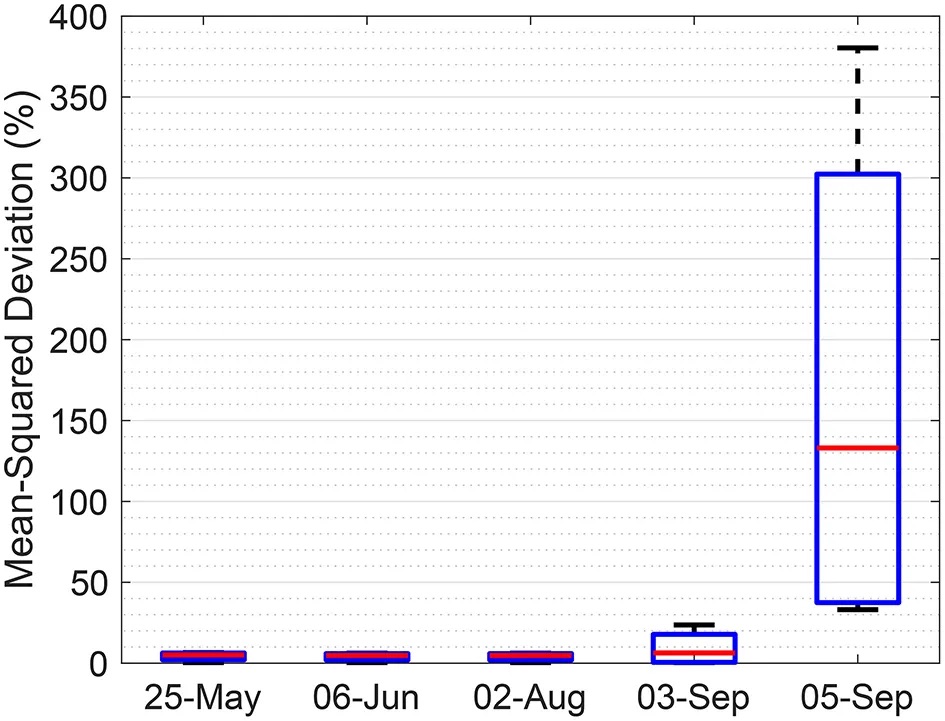
The bridge has natural frequencies near 1 Hz. This value is near the walking rate of pedestrians. During the Labor Day walk, thousands of pedestrians cross the bridge at the same time. Monitoring data from this event showed a much larger response than typical heavy-truck traffic.

Labor Day walk response plot from Mackinac Bridge monitoring
The Labor Day walk produced a clear high-response anomaly.The measured bridge response was substantially larger than the response during normal heavy-truck traffic.

Monitoring on the Mackinac Bridge is ongoing. We are honored to help preserve one of Michigan's most important and recognizable assets.

Long-term data lets engineers compare routine traffic with unusual synchronized loads. The same method can help other long-span bridge teams evaluate load response, fatigue demand, and sensor performance.

Compare each asset with its normal response.

Continuous measurements let engineers compare normal operation with severe weather, unusual loading, damage, or other changes. This method applies to bridges, pavements, buildings, airports, and other infrastructure assets. It helps engineers identify changes that require further analysis.

Discuss a monitoring project